A PowerPoint (or PPT) presentation usually consists of many slides that show various types of data. The slides can have images, texts, art clips, videos etc. You can also show charts in the slides, imported from various sources, like an Excel worksheet.
You can copy and paste the charts to your PPT slides. However, if you have multiple charts across multiple worksheets in Excel, you can efficiently export all charts (or specific charts) in PPT, with the click of a button.
The Data for the Charts
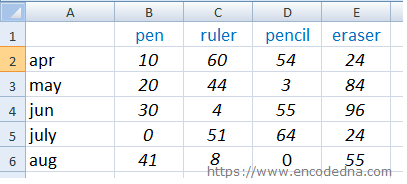
I have some data in my Excel worksheet. The data is similar to one I have used in my previous post. You can add more data.

I am creating multiple charts with the above data, dynamically using VBA. You can create the charts, as you want.
The VBA Code
The procedure or code that exports these charts to PowerPoint is called when a user clicks a button. Therefore, insert an ActiveX button control in your worksheet.
Next, open the VBA editor.
To work with PowerPoint from Excel, you’ll have to first add a PowerPoint library reference to your VBA application.
1) From the top menu in your VBA editor, choose Tools – References. It will open the References dialog box.
2) In the dialog box, find Microsoft PowerPoint 12.0 Object Library and click OK. Or any version, which is installed in your computer. See the image.
Since, I have added a button control in my worksheet, I’ll write the code to call a procedure in the button’s click event.
Option Explicit

Private Sub CommandButton1_Click()
    exportCharts2Ppt
End Sub

Sub exportCharts2Ppt()

    ' Create a PowerPoint application object.
    Dim objPPT As PowerPoint.Application
    Set objPPT = New PowerPoint.Application
    objPPT.Visible = True           ' Make the PPT visible.
    objPPT.Activate

    ' Create a PowerPoint presentation object.
    Dim objPptPre As PowerPoint.Presentation
    Set objPptPre = objPPT.Presentations.Add

    ' We'll show different charts in different slides in our PowerPoint presentation.
    ' Therefore, create an object for PPT slides.
    Dim objPPTSlides As PowerPoint.Slide

    Dim iNdx As Integer     ' Index, or position of each slide.
    iNdx = 1

    Dim objChart As ChartObject
    Dim objWS As Worksheet

    For Each objWS In ActiveWorkbook.Worksheets     ' Loop through all the worksheets.
        For Each objChart In objWS.ChartObjects     ' Loop through all the Chart Objects.

            objChart.Chart.ChartArea.Copy       ' Copy all the charts to the Clipboard.
            ' Debug.Print objChart.Chart.Name

            Set objPPTSlides = objPptPre.Slides.Add(iNdx, ppLayoutBlank)       ' Create a new slide with a blank layout.
            objPPTSlides.Shapes.PasteSpecial ppPasteDefault, msoTrue           ' Extract the chart from the Clipboad and paste it.

            iNdx = iNdx + 1         ' Increment the slide index (or position).
        Next objChart
    Next objWS

End SubThe macro has inline comments explaining the variables and the various objects that I have declared and used for exporting the charts to a PowerPoint application.
Inside the procedure exportCharts2Ppt(), I have first declared a PowerPoint "Application" object and initialized it. I am also making it visible, so you can see the creation of the slides, one by one.
Dim objPPT As PowerPoint.Application
The next objects are the PowerPoint Presentation object (to hold the slides with the charts) and the PowerPoint Slide.
Dim objPptPre As PowerPoint.Presentation
Dim objPPTSlides As PowerPoint.Slide
Using two For Each loops, the macro next iterates through all the "worksheet" in the file and looks for Charts. It copies the charts in a Clipboard, creates a PPT "Slide" each for the charts, extracts the chart one by one from the Clipboard and pastes it the slide.
For Each objWS In ActiveWorkbook.Worksheets
	For Each objChart In objWS.ChartObjects
		…
Next objChart
Next objWS
If you do everything right, then the above macro will create a PowerPoint application and add the charts in multiple slides.
Make Charts online using our Graph Maker:
From raw JSON data, you can make various charts (or graphs) like pie chart, line chart, column chart etc. dynamically using this simple tool.
Turn raw JSON data into meaningful charts.
Try the Graph Maker ➪
