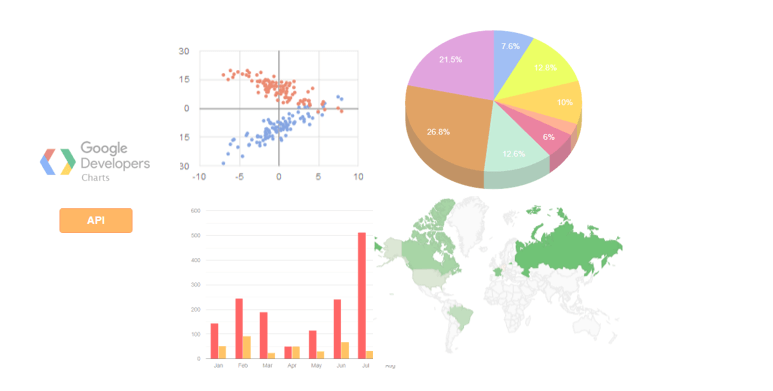
Learn more about Google Charts API.
Frequently Asked Questions.
What types of charts can I create with the Graph Maker?
The Graph Maker tool supports a variety of chart types, ensuring flexibility for different kinds of data visualizations. Here are the types of charts you can create.
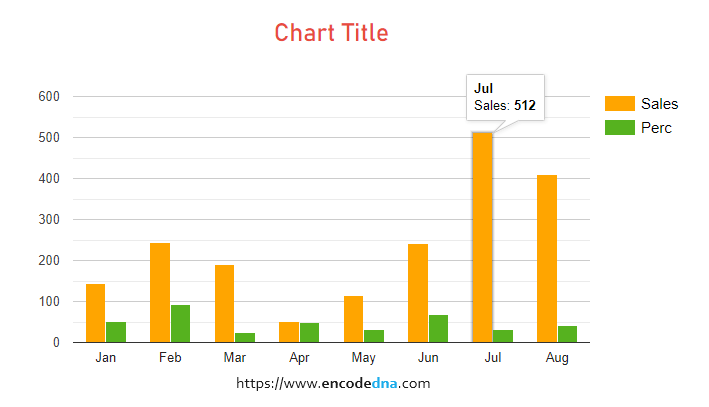
1) Bar Graphs: Ideal for comparing quantities across categories.
2) Pie Charts: Perfect for showcasing proportions or percentages within a dataset.
3) Line Graphs: Excellent for visualizing trends or changes over time.
4) Column Charts: Similar to bar graphs but with vertical columns, great for comparing data.
5) Donut Charts: A variation of pie charts with a blank center, great for showcasing proportions.
6) Bubble Charts: Useful for visualizing three dimensions of data, with the size of the bubbles representing an additional variable.
7) Table Charts: Helps in representing data in a tabular form, making it easy to read and compare values.
How to make a Pie Chart using EncodeDna.com's Graph Maker?
Creating a pie chart using this tool is simple. Follow these steps.
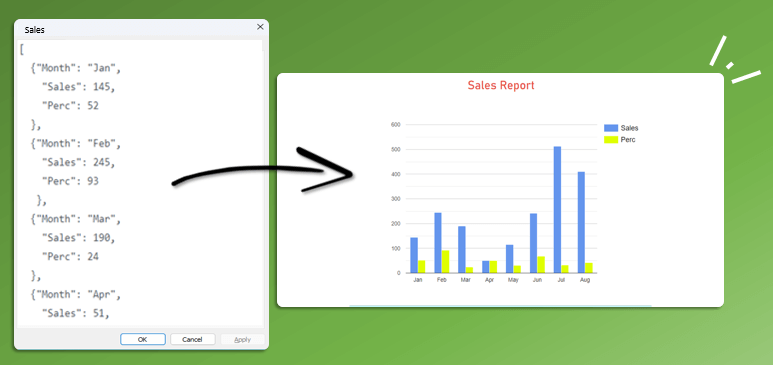
1) Prepare Your JSON Data: Ensure your data is formatted correctly in JSON. Example,
[
    { "Month": "Jan", "Sales": 145, "Percentage": 52 },
    { "Month": "Feb", "Sales": 245, "Percentage": 93 },
    { "Month": "Mar", "Sales": 190, "Percentage": 24 },
    { "Month": "Apr", "Sales": 51, "Percentage": 50 },
    { "Month": "May", "Sales": 115, "Percentage": 31 }
]
2) Paste Your JSON Data: Copy your JSON data and paste it into the designated input box on the tool's webpage.
3) Select "Pie Chart": Choose "Pie Chart" from the available chart types. See the Chart Type.
4) Customize Your Chart: Add a title, adjust colors and modify the legend as needed.
5) Generate the Chart: Click the button Update Chart to convert your JSON data into a pie chart.
6) Print and Share : Once generated, you can print, save as a PDF or share the chart with others.
What are the Benefits of using a Graph Maker?
Using a graph maker offers several advantages, especially when working with JSON data and the Google Charts API. Here are the key benefits.
1) Simplifies Data Visualization: Instead of interpreting raw numbers, charts make it easy to spot trends, comparisons and relationships at a glance.
2) No Coding Required: This tool lets you generate graphs without needing to write complex code, making it accessible to beginners and non-programmers.
3) Multiple Chart Options: Whether you need bar graphs, pie charts, line charts, column charts, bubble charts or donut charts, the tool provides flexibility to match different data visualization needs.
4) Interactive and Dynamic: Since it uses Google Charts API, the graphs are interactive, allowing users to hover over elements for detailed insights.
5) Free and No Sign-Up: Unlike some premium tools, this graph maker is entirely free, and you don’t have to register or create an account.
6) Easy to Share and Export: Once generated, you can download, print, or convert charts into PDFs, making them convenient for presentations and reports.
7) Error Checking for JSON Data: The tool includes a JSON validator to help ensure your data is properly formatted before creating a graph.
What makes the EncodeDna.com's graph maker the best free graph maker online?
Encodedna.com's Graph Maker is a free and easy-to-use tool for creating interactive charts from JSON data using the Google Charts API. With multiple chart options like pie charts, bar graphs, and line charts, it simplifies data visualization without requiring coding skills. The tool also features a built-in JSON validator, ensuring accurate formatting for seamless graph generation. Additionally, users can export, print or share their charts, making it a convenient solution for presentations and reports.


