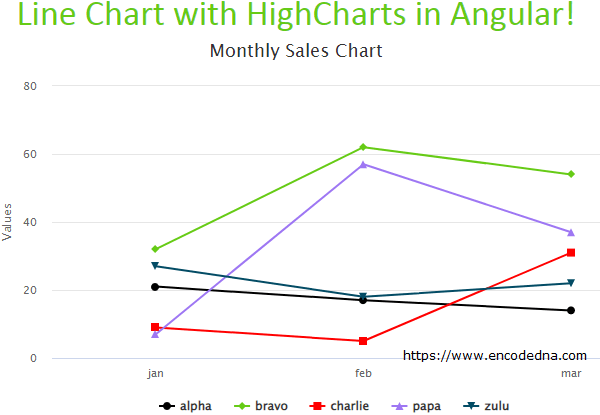
Create an application using Angular Command Line Interface or the CLI. Open the command prompt and go to the folder where you want to "create the project".
ng new angularLineChart
Go to the folder…
cd angularLineChart
and launch the server…
ng serve --o
Install HighChart Library
Install the library via command line.
npm install highcharts
Note: Do not re-install if you have already installed it.
Create JSON file
We are using JSON data for the chart and the data is extracted from an External JSON file. So, we’ll first create a JSON file.
Go to assets folder. You can find this folder under src folder in your Angular project. Create a file named sales-data.json, copy the below JSON in the file and save it.
[
    { "name": "alpha", "data": [21, 17, 14] },
    { "name": "bravo", "data": [32, 62, 54] },
    { "name": "charlie", "data": [9, 5, 31] },
    { "name": "papa", "data": [7, 57, 37] },
    { "name": "zulu", "data": [27, 18, 22] }
]Remember: You’ll have to create and save the JSON file inside assets folder.
/src/assets/sales-data.json
Open app.module.ts file under src/app/ folder and add HttpClientModule.
import { BrowserModule } from '@angular/platform-browser';
import { NgModule } from '@angular/core';
import { AppComponent } from './app.component';

import { HttpClientModule } from '@angular/common/http';

@NgModule({
  declarations: [
    AppComponent
  ],
  imports: [
    BrowserModule,
    HttpClientModule
  ],
  providers: [],
  bootstrap: [AppComponent]
})
export class AppModule { }Next, we’ll create our component, where we’ll integrate HighCharts by importing the library and we’ll also import HttpClient service.
• Adding HttpClient service to our component will ensure that we have access to the get() method and properties that we need to access files in the server.
Open app.component.ts file and add the below code.
import { Component, OnInit } from '@angular/core';

import { HttpClient } from '@angular/common/http';
import { HttpErrorResponse } from '@angular/common/http';

import * as Highcharts from 'highcharts'    // import highcharts library

@Component({
  selector: 'app-root',
  templateUrl: './app.component.html',
  styleUrls: ['./app.component.css']
})
export class AppComponent {
  title = 'Line Chart with HighCharts in Angular';

  constructor (private httpService: HttpClient) {   }

  public arrSales = [];
  public chartData: any = {
    chart: {
      type: 'line'
    },

    xAxis: {    // the 'x' axis or 'category' axis.
        categories: ['jan', 'feb', 'mar']
    },

    title: {
        text: 'Monthly Sales Chart'
    },

    series: [
      {
        data: []
      }
    ],

    colors: ['#000', 'rgb(102,203,22)', 'red', '#9e77f3', '#034C65'],

    tooltip: {
        backgroundColor: '#FCFFC5'
    }
  }

ngOnInit () {
    // DYNAMIC

    this.httpService.get('./assets/sales-data.json', {responseType: 'json'}).subscribe(
      data => {
        this.arrSales = data as any[];    // populate array with json.
        this.showChart();         // show the chart.
      },
      (err: HttpErrorResponse) => {
        console.log (err.message);
      }
    );
  }

  showChart () {
    this.chartOptions.series = this.arrSales;       // assign data to the series.
    Highcharts.chart('div-container', this.chartOptions);    // Update the chart.
  }
}Note: I have explained about HighCharts options and methods in detail in this post.
👉 Do you know, you can generate Multiple charts in Angular using HighCharts and with JSON data extracted from a single file? Yes you can. Check this out.
🚀 You can also export charts to various formats. Check this out.
The default chart type in HighCharts is the line chart. You can ignore this option (for line charts only). However, its good to define a type explicitly.
chart: { type: 'line' },Now, see the series object. There is no data in it.
series: [
    {
        data: []
    }
],
In my previous post, I have hardcoded the data. However here, the data is dynamic and is extracted from a JSON file.
Therefore, the data for the chart is first populated into an array after making an HTTP call using get() method,
this.httpService.get('./assets/sales-data.json', {responseType: 'json'}).subscribe(
    data => {
        this.arrSales = data as any[];
        this.showChart();
    },
        (err: HttpErrorResponse) => {
        console.log (err.message);
    }
);
and later I have assigned the data to the chart series (dynamically).
showChart () {
    this.chartOptions.series = this.arrSales;
    Highcharts.chart('div-container', this.chartOptions);
}Finally, create the template for the project. It has a DIV element with id div-container. Its where the chart will be displayed.
<div style="text-align:center; width: 700px">
  <h1>
    {{ title }}!
  </h1>
</div>

<div id="div-container" style="width: 700px;"></div>
That’s it. Your Line chart is ready for display.
Run the application.
ng serve --o
