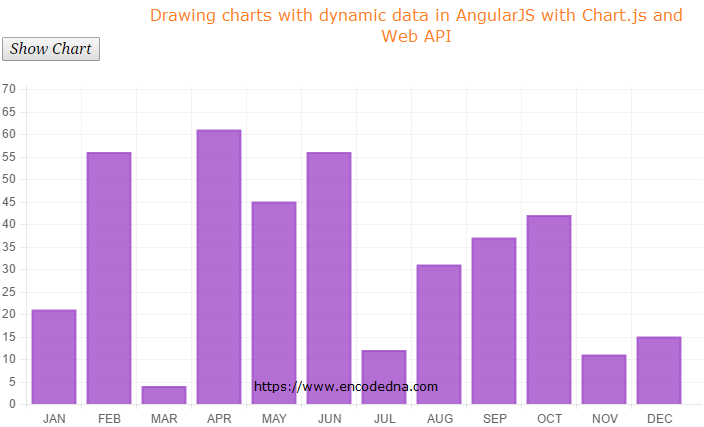
When I say dynamic data, I mean data extracted from an SQL Server database. An Asp.Net Web API controller would provide the data to my AngularJS app. Along with it, I will use $http to call the API, extract data and use the data for my chart.
The Asp.Net Web API controller and model are written in C# and Vb.
Before you start designing your application, you must first download Charts.js and Angular Chart from Github.
You can either download chart.js library or use the Chart.js CDN in your application.
Note: I am using Chart.js CDN in the example, here in this post.
Next, you will also need to download angular-chart.js file in your machine. Save the file the root directory of your application.
Since I am extracting data from SQL Server database, I will need a table. The table dbo.Books_Annual_Sales has two columns, Month and SalesFigure. A bar chart that I am drawing here, has two sides. See the image above. The bars are the SalesFigure for each month.
CREATE TABLE [dbo].[Books_Annual_Sales](
	[Month] [varchar](50) NULL,
	[SalesFigure] [int] NULL
) ON [PRIMARY]
After you have created the table, just add for each month with a sales figure starting from Jan. For example,
INSERT INTO dbo.Books_Annual_Sales VALUES ('JAN', 21)
INSERT INTO dbo.Books_Annual_Sales VALUES ('FEB', 56)
and so on.
using System;
using System.Collections.Generic;
using System.Linq;
using System.Net;
using System.Net.http;
using System.Web.http;

using BooksApp.Models;
using System.Data.SqlClient;

namespace BooksApp.Controllers
{
    public class BooksController : ApiController
    {
        // LIST OBJECT WILL HOLD AND RETURN A LIST OF MONTHLY SALES.
        List<Books> MyBooks = new List<Books>();

        public IEnumerable<Books> Get()
        {
            string sConnString = "Data Source=DNA;Persist Security Info=False;" +
                "Initial Catalog=DNA_Classified;User Id=sa;Password=demo;Connect Timeout=30;";

            SqlConnection myConn = new SqlConnection(sConnString);

            // THE SQL QUERY TO GET THE SALES FIGURES FROM THE TABLE.
            SqlCommand objComm = new SqlCommand("SELECT *FROM dbo.Books_Annual_Sales", myConn);
            myConn.Open();

            SqlDataReader reader = objComm.ExecuteReader();

            // POPULATE THE LIST WITH DATA.
            while (reader.Read())
            {
                MyBooks.Add(new Books { Month = reader["Month"].ToString(),
                   SalesFigure =  reader["SalesFigure"].ToString()});
            }
            myConn.Close();

            return MyBooks;
        }
    }
}
>
using System;
using System.Collections.Generic;
using System.Linq;
using System.Web;

namespace BooksApp.Models
{
    public class Books
    {
        public string Month { get; set; }
        public string SalesFigure { get; set; }
    }
}
using System;
using System.Collections.Generic;
using System.Linq;
using System.Web.http;

namespace BooksApp
{
    public static class WebApiConfig
    {
        public static void Register(HttpConfiguration config)
        {
            config.Routes.MapHttpRoute(
                name: "DefaultApi",
                routeTemplate: "api/{controller}/"
            );
        }
    }
}
Option Explicit On

Imports System.Net.http
Imports System.Web.http

Imports System.Data.SqlClient
Imports BooksApp.BooksApp.Models

Namespace BooksApp
    Public Class BooksController
        Inherits ApiController

        ' LIST OBJECT WILL HOLD AND RETURN A LIST OF MONTHLY SALES.
        Dim MyBooks As New List(Of Books)()

        Public Function [Get]() As IEnumerable(Of Books)
            Dim sConnString As String = "Data Source=DNA;Persist Security Info=False;" & _
                "Initial Catalog=DNA_Classified;User Id=sa;Password=demo;Connect Timeout=30;"

            Dim myConn As New SqlConnection(sConnString)

            ' THE SQL QUERY TO GET THE SALES FIGURES FROM THE TABLE.
            Dim objComm As New SqlCommand("SELECT *FROM dbo.Books_Annual_Sales", myConn)

            myConn.Open()

            Dim reader As SqlDataReader = objComm.ExecuteReader()

            ' POPULATE THE LIST WITH DATA.
            While reader.Read()
                MyBooks.Add(New Books() With { _
                    .Month = reader("Month").ToString(), _
                    .SalesFigure = reader("SalesFigure").ToString() _
                 })
            End While

            myConn.Close()

            Return MyBooks          ' FINALLY, RETURN THE LIST.
        End Function
    End Class
End Namespace
Imports System.Web

Namespace BooksApp.Models
    Public Class Books
        Public Property Month() As String
            Get
                Return m_Month
            End Get
            Set(value As String)
                m_Month = value
            End Set
        End Property
        Private m_Month As String

        Public Property SalesFigure() As String
            Get
                Return m_SalesFigure
            End Get
            Set(value As String)
                m_SalesFigure = value
            End Set
        End Property
        Private m_SalesFigure As String
    End Class
End Namespace
Imports System
Imports System.Collections.Generic
Imports System.Linq
Imports System.Web.http

Public Class WebApiConfig
    Public Shared Sub Register(ByVal config As HttpConfiguration)
        config.Routes.MapHttpRoute( _
            name:="DefaultApi", _
            routeTemplate:="api/{controller}/" _
        )
    End Sub
End ClassIn the markup section, I have included 3 CDN’s. That is, AngularJS, jQuery and the CDN for Chart.js. The forth <script> is the angular-chart.js, which I have saved in the root directory of my application.
<!DOCTYPE html>
<html>
<head>
    <title>Drawing Charts in AngularJS</title>

    <script src="https://ajax.googleapis.com/ajax/libs/angularjs/1.5.0/angular.min.js"></script>
    <script src="https://ajax.googleapis.com/ajax/libs/jquery/1.10.1/jquery.min.js"></script>
    <script src="https://cdnjs.cloudflare.com/ajax/libs/Chart.js/1.1.1/Chart.min.js"></script>
    <script src="angular-chart.js"></script>
</head>
<body>
    <div ng-app="myChart"
        ng-controller="myController" style="width:700px;">

        <p><button ng-click="requestData()">Show Chart</button></p>

        <canvas id="bar"
            class="chart chart-bar"
            data="data"
            labels="labels"
            colours="colors">
        </canvas>
    </div>
</body>
If you have noticed, I have a button control that will call a function in the controller to request data from the API using $http.
I have included the HTML5 <canvas> element with few directives and a class.
<script>
    var myApp = angular.module('myChart', ["chart.js"]);

    myApp.controller(
        'myController',
            function ($scope, $http) {

                $scope.requestData = function () {
                    var arrData = new Array();
                    var arrLabels = new Array();

                    $http.get("/api/books/").success(function (data) {

                        $.map(data, function (item) {
                            arrData.push(item.SalesFigure);
                            arrLabels.push(item.Month.split(','));
                        });

                        $scope.data = [];
                        $scope.labels = [];

                        $scope.data.push(arrData.slice(0));

                        for (var i = 0; i < arrLabels.length; i++) {
                            $scope.labels.push(arrLabels[i]);
                        }
                    }).error(function (status) {
                        alert(status);
                    });
                };

                // NOW, ADD COLOURS TO THE BARS.
                $scope.colors = [
                    {
                        fillColor: 'rgba(161, 75, 201, 0.8)',
                        strokeColor: 'rgba(161, 75, 201, 0.8)',
                        highlightFill: 'rgba(161, 75, 201, 0.8)',
                        highlightStroke: 'rgba(161, 75, 201, 0.8)'
                    }
                ];
            });
</script>
</html>First, I’ll add the chart.js dependency to my module.
var myApp = angular.module('myChart', ["chart.js"]);
Inside the controller, I have a function requestData(), which I’ll call using the button (click). The function has $http to request data from the Web API. Once it successfully extracts data from the API, I’ll first add it in two Arrays, that is, arrData and arrLabels.
The arrays now hold the data for the chart. In the markup section, the HTML5 canvas has three directives namely, data, labels and colours. The first two directives will get data from the two arrays.
The data directive will have the Sale Figures and labels directive will have months. The 3rd directive colours will have color properties for the bars. I am assigning values to the properties at the end.
$scope.colors = [
    {
        fillColor: 'rgba(161, 75, 201, 0.8)',
        strokeColor: 'rgba(161, 75, 201, 0.8)',
        highlightFill: 'rgba(161, 75, 201, 0.8)',
        highlightStroke: 'rgba(161, 75, 201, 0.8)'
    }
];
Well, that’s it. If everything goes well, you will see an animated chart on your web page, with the click of a button. The good thing is that data is dynamic.
