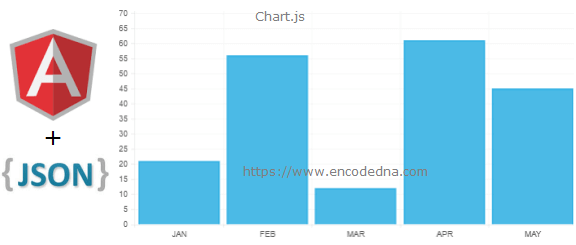
Chart.js
First, download angular-chart.js on your machine. It’s a library with properties and methods for creating charts. Save the file in the root directory of your application.
Next, you can either download chart.js library or use the Chart.js CDN in your application.
Save the below JSON data in a file named sample.json.
[
    {
   "Month": "JAN",
   "SaleFigure": "21"
},
	{
    "Month": "FEB",
    "SaleFigure": "56"
},
	{
    "Month": "MAR",
    "SaleFigure": "4"
},
	{
    "Month": "APR",
    "SaleFigure": "61"
},
	{
    "Month": "MAY",
    "SaleFigure": "45"
},
	{
    "Month": "JUN",
    "SaleFigure": "56"
},
	{
    "Month": "JUL",
    "SaleFigure": "12"
},
	{
    "Month": "AUG",
    "SaleFigure": "31"
},
	{
    "Month": "SEP",
    "SaleFigure": "37"
},
	{
    "Month": "OCT",
    "SaleFigure": "42"
},
	{
    "Month": "NOV",
    "SaleFigure": "79"
},
	{
    "Month": "DEC",
    "SaleFigure": "11"
}
]I have two CDN’s in the <head> section. The first is for AngularJS and second is for chart.js. I have also added the angular-chart.js file, the file I have downloaded and copied in my root directory.
<!DOCTYPE html>
<html>
<head>
    <script src="https://ajax.googleapis.com/ajax/libs/angularjs/1.5.0/angular.min.js"></script>
    <script src="https://cdnjs.cloudflare.com/ajax/libs/Chart.js/1.1.1/Chart.min.js"></script>
    <script src="angular-chart.js"></script>
</head>
<body>
    <div ng-app="myChart"
        ng-controller="myController" style="width:700px;">

        <canvas id="bar"
            class="chart chart-bar"
            data="data"
            labels="labels"
            colours="colors">
        </canvas>
    </div>
</body>
chart.js uses HTML5 canvas element to create the charts. For more information, please go through this post.
Add the chart.js dependency to the Angular module. I am using the GET method to request data from file using AngularJS $http service. Once a request is made successfully, it will loop through data in file using AngularJS forEach() method, pushing data into two separate arrays. Use the data in the arrays to update $scope properties to provide data to the chart.
<script>
    var myApp = angular.module('myChart', ["chart.js"]);

    myApp.controller('myController',
        function ($scope, $http) {

            // REQUEST OPTIONS USING GET METHOD.
            var request = {
                method: 'get',
                url: 'chartdata.json',
                dataType: 'json',
                contentType: "application/json"
            };

            $scope.arrData = new Array;
            $scope.arrLabels = new Array;

            // MAKE REQUEST USING $http SERVICE.
            $http(request)
                .success(function (jsonData) {

                    // LOOP THROUGH DATA IN THE JSON FILE.
                    angular.forEach(jsonData, function (item) {
                        $scope.arrData.push(item.SaleFigure);
                        $scope.arrLabels.push(item.Month);
                    });

                    $scope.data = new Array;
                    $scope.labels = new Array;

                    // UPDATE SCOPE PROPERTIES “data” and “label” FOR DATA.
                    $scope.data.push($scope.arrData.slice(0));

                    for (var i = 0; i < $scope.arrLabels.length; i++) {
                        $scope.labels.push($scope.arrLabels[i]);
                    }
                })
                .error(function () {

                });

            // NOW, ADD COLOURS TO THE BARS.
            $scope.colors = [{
                fillColor: 'rgba(30, 169, 224, 0.8)',
                strokeColor: 'rgba(30, 169, 224, 0.8)',
                highlightFill: 'rgba(30, 169, 224,, 0.8)',
                highlightStroke: 'rgba(30, 169, 224, 0.8)'
            }];
        });
</script>
</html>That’s it. Now you can use a JSON file as a data source for your charts in AngularJS. Thanks for reading. ☺
